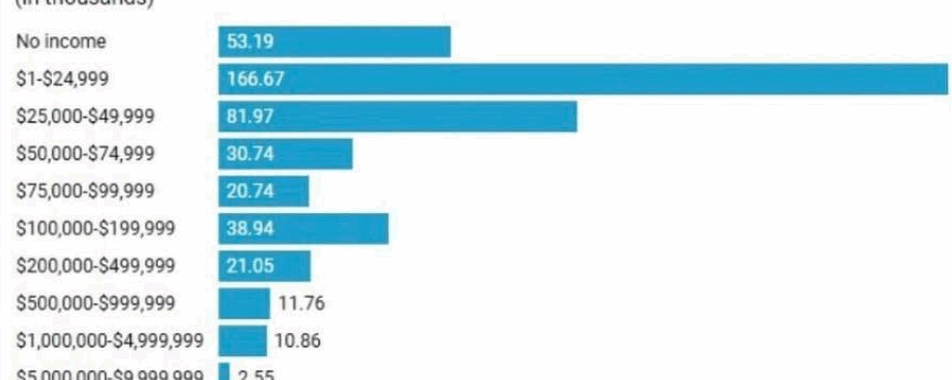
Denominator Blindness in IRS Audits
This graph again demonstrates Denominator Blindness, now in IRS audits.
Looking at the above graph, the average person would think that those at low income are most likely to be audited by the IRS. This could be further from the truth and is a result of denominator blindness.
When we review the number of audits per person who files, the chart looks very different.
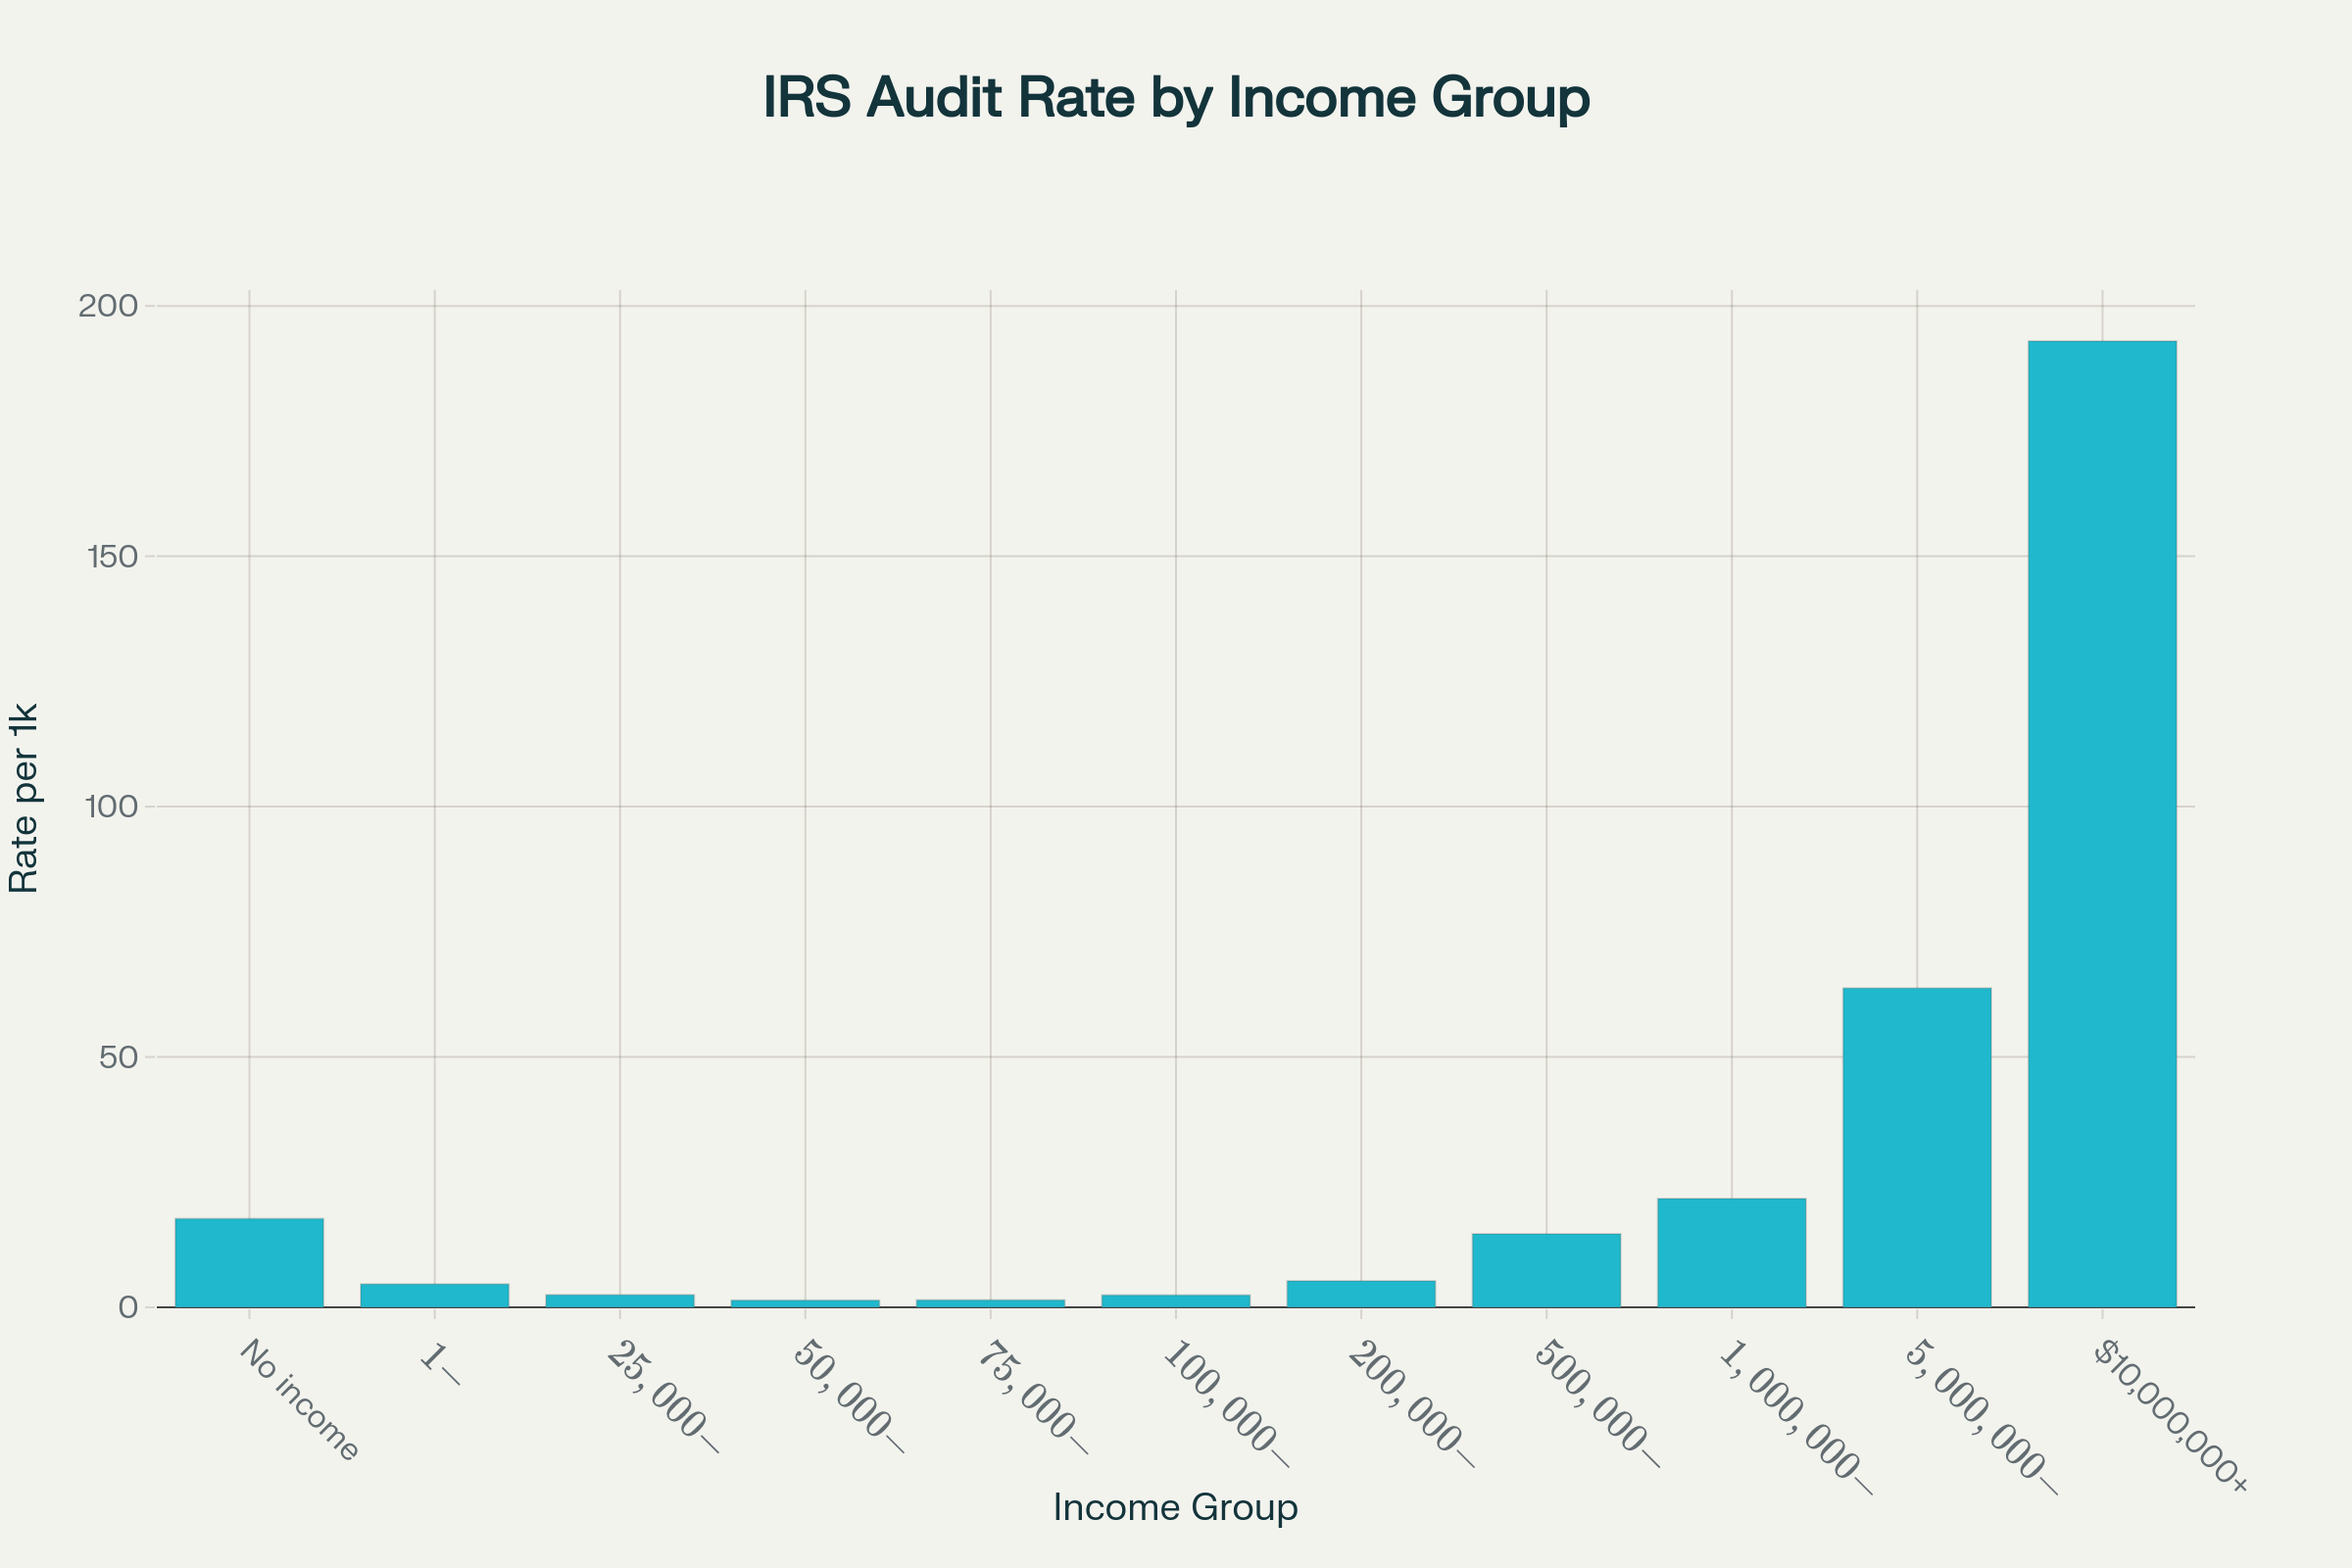
Here is the most meaningful way to interpret the original chart: by showing the rate of IRS examinations per 1,000 returns filed for each income group. This answers the question: “How likely is someone in each income bracket to be audited?”
For the lowest income group (“No income”), there are approximately 17.7 audits per 1,000 returns.
For those earning $1–$24,999, it decreases to 4.6 per 1,000.
For the $25,000–$99,999 middle brackets, it’s approximately 1.4 to 2.5 audits per 1,000.
The rates increase for high earners: 14.7 per 1,000 for $500K–$1M, 21.7 per 1,000 for $1M–$5M, 63.8 per 1,000 for $5M–$10M, and an impressive 193 per 1,000 for $10M+ (meaning nearly 1 in 5 of the highest-income filers are examined).
This corrects the visual distortion in the original chart by displaying the actual number of returns in each income bracket, making it clear that audit rates are low for middle- and upper-middle-income households but extremely high for the very poor—often due to Earned Income Tax Credit audits—and for the very wealthy.