Chapter 5: REPRODUCTION NUMBERS AND HERD PROTECTION
[Viral replication, a chapter I honestly had forgotten I wrote. In 2020, we were told we could flatten the curve in 14 days, which was absurd from the start. What would happen after those 14 days? Chapter 5 contains many numbers that explain why this campaign was unrealistic, and why they shadow-banned From Killer to Common Cold. I said in 2020, “After all, we will never eradicate Covid-19.“]
Reproduction Numbers
There have been many numbers thrown around during this pandemic, so I want to take time to understand some of them. Numbers out of context rarely provide useful insights. If we can understand the basics of viral replication, we can better grasp why the models have been so inaccurate during this pandemic and, perhaps, better anticipate the future of the pandemic.
R naught
One especially important number is R naught (R0). R0, also called the basic reproduction number, indicates how contagious a virus is. It is not a fixed biological constant; instead, R0 depends on the interactions between the host (in this case, humans) and the virus. Non-pharmacological measures like social distancing and wearing masks affect R0 by reducing viral spread.
For example, early in the pandemic, before we understood how contagious Covid-19 was, people socialized freely and interacted normally. During that time, the R0 was very high because one person infected many others. As we limited our interactions, fewer people were exposed, causing R0 to decrease. When asymptomatic infected individuals wear masks, they reduce the number of contagious particles in the air, which in turn lowers transmission and thus the R0 value. R0 changes over time as people’s behaviors change. While the virus remains just as contagious, our actions influence how it spreads.
R0 assumes a completely susceptible, non-immune population. This is very important to understand. Early in a new epidemic, nobody has been exposed to the virus, so there is no immunity in the population. As immunity develops, R0 becomes less useful because immunity reduces transmission. When calculating R0, immunity in the population is assumed to be zero. For a truly new virus, pre-existing immunity is unlikely. However, as we learned in the last chapter, there is some pre-existing or partial cross-reactive immunity to Covid-19 because of endemic coronaviruses. The assumption that there was no pre-existing immunity to Covid-19 made initial R0 calculations unreliable.
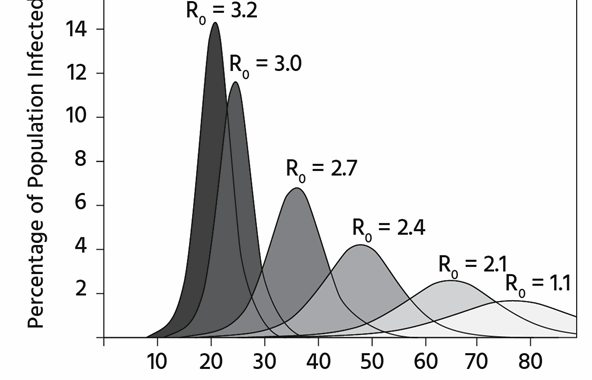
Therefore, R0 is valuable early in epidemics because it directly relates to the number of individuals who will be infected during the initial wave. The campaign to “flatten the curve” aimed to reduce R0 and decrease the wave’s peak. The same number of people would become infected, but over a longer period, which would help avoid crises caused by shortages of ICU beds and ventilators. [They lied about this, too.]
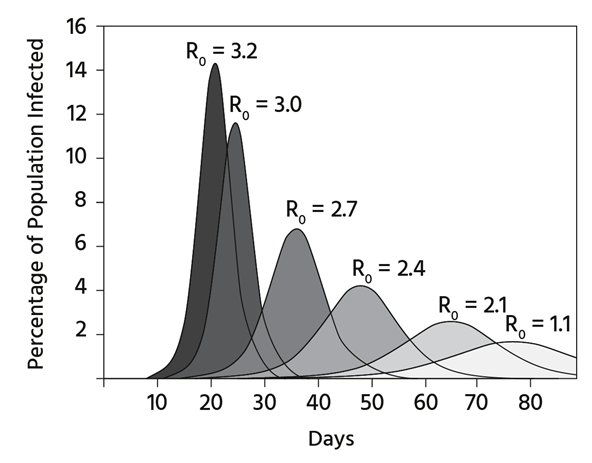
Source: Centers for Disease Control and Prevention
Above, you can see that the spike in the percentage of the population that becomes infected depends on R0. A higher R0 indicates a faster and more widespread infection rate. [I should have mentioned that the area under the curve is the same, which means that even if you reduce RO, the same number of people get infected.]
Additionally, R0 indicates whether the epidemic is expanding. If the R0 value exceeds one, the growth is exponential. The higher the number, the steeper the exponential increase. If R0 is less than one, each infected person transmits the virus to fewer than one other person, causing the epidemic to decline. R0 is typically calculated by tracking how many people an initial case infects and then uses models. In a mathematical model, we can directly determine the herd immunity threshold (HIT) from R0.
HIT
HIT is the minimum percentage of the population that needs to be immune to stop the spread of an infection. It is calculated simply by [1 – (1/R0)]. This means you take 1, divide it by R0, and then subtract that value from 1. As R0 increases (indicating a more contagious virus), a higher percentage of herd immunity is required to stop transmission. This makes sense because a highly contagious pathogen will spread unless most people are immune.
You can stop exponential transmission by reducing R0 below 1. If you substitute 1 for R in the formula, you get [1 – (1/1)] = 0%. This shows that if the disease only transmits to one other person, you need 0% of the population to be immune to prevent exponential growth.
Lowering R0 below one reduces the severity of the epidemic but does not stop transmission. This is an important point to remember, and it will be explained in more detail in a later chapter.
Now, let’s examine R0 in relation to several human diseases.
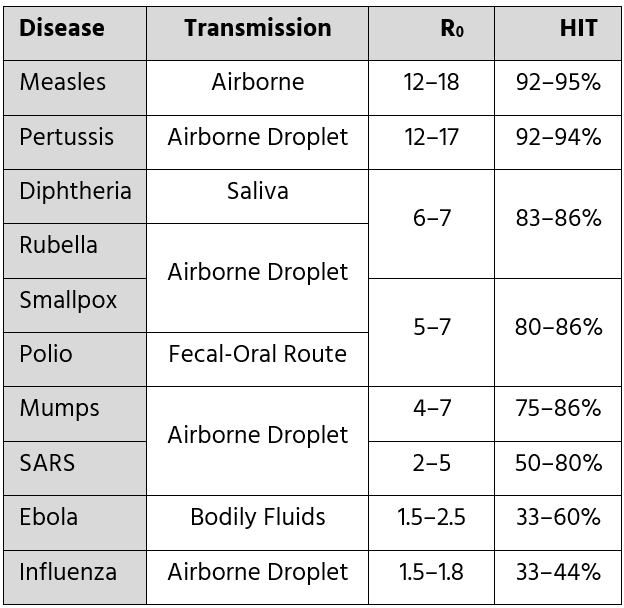
Source: Wikipedia [We should use these numbers as goals for immunization rather than 95%. What do you think?]
As shown above, a higher R0 indicates that a higher herd immunity threshold (HIT) is required to halt transmission. Measles is the most contagious among the examples, with an R0 in the double digits. Therefore, more than 90% of the population must be immune to end a measles epidemic. At the bottom, pandemic influenza is much less contagious and can die out after about a third of people are infected.
SARS has an R0 ranging from 2 to 5, meaning that roughly 50 to 80% of the population needs to be immune to prevent its spread. I previously mentioned that SARS was eradicated from human populations because we effectively controlled its transmission. Although SARS’s R0 is quite high, remember that people do not become contagious until after they are already sick. With SARS, simple infection control practices lowered the R0 from 2–5 to below 1. Keep in mind, R0 is not a fixed biological constant; it depends on the interaction between the virus and the host. If the host alters infection control practices, the R0 will change as well.
The R0 of COVID-19 is estimated to be around 2.5–3, so initial estimates suggest that 60–80% of the population will need to be exposed to the disease or effectively vaccinated before the pandemic can be brought to an end. This is a good starting point, but there is much more to discuss on the topic.
R0 and the HIT both assume immunologically naïve populations. What happens once some people are exposed to the virus and develop immunity? Let’s learn about RE, or R Effective.
RE
R Effective (RE) considers immunity. The more immune people there are, the harder it is for a virus to spread. This makes sense, and RE becomes an important number to consider once either the virus has significant penetration in a population or a vaccine is available.
RE might be a better number to consider after you’ve gone through the first wave of the epidemic. The second wave will have an R0 that depends on the cultural practices of the host species (such as physical distancing and masks), but as more people become immune, RE decreases more than R0.
RT
The current reproductive rate in a community is represented by R Time (RT). RT indicates the reproductive rate at the present moment, considering all factors that influence viral transmission within the community. RT is calculated based on the observed level of transmission. In other words, if you compare the number of cases from last week with projections for the next week, you can infer the RT. If you follow websites reporting on infection rates, this is likely RT. Using this number, you effectively measure the attack rate, which is vital information.
Interlude
R0 considers host effects such as sheltering in place, physical distancing, and masking when these measures are in place, but not immunity. RE accounts for immunity from prior infection or vaccination. RT estimates the current reproductive rate of the virus. Reaching HIT stops disease transmission in a population (eventually).
We must look at herd immunity differently with Covid-19, because you can get it again. With smallpox or measles, once you get it, you are protected for life. The story of immunity and SARS-CoV-2 is much more complicated than what can be explained by R0 and herd immunity.
Attack Rate
Instead of R0 or RE, we should focus on the attack rate. The attack rate is important because it indicates the number of secondary infections that result from an index case. It provides another way to measure infection risk. The attack rate is shown as a whole number. For example, if two people are infected by the index case, the attack rate is two. It is calculated by dividing the number of people who get infected by the total number at risk. The attack rate can be lowered by factors like non-pharmaceutical interventions that affect R0, immunity that influences RE, local effects, and especially, partial, non-specific, pre-existing, cross-reactive immunity.
Partial, Non-Specific, Pre-Existing, Cross-Reactive Immunity
Let’s repeat it: partial (not always fully protective), non-specific (not from prior Covid-19), pre-existing (present before SARS-CoV-2 appeared in populations), cross-reactive immunity (providing some memory T-cell protection from Covid-19). This is not complete immunity to Covid-19 (which may not even be possible), but rather partial protection from a previous common cold coronavirus. For example, if you get infected with a non-Covid-19 coronavirus and have memory T-cells that cross-react and prevent SARS-CoV-2 infection, this non-specific immunity reduces the attack rate but does not impact R0 or RE. Lowering the attack rate decreases the total number of people who could get infected with Covid-19 in any population where SARS-CoV-2 is circulating.
Instead of herd immunity, we should prioritize herd protection.
Herd Protection
Herd protection is the point at which we slow or stop the epidemic transmission. Once herd protection is achieved, regional communities no longer experience regional epidemics. It’s the threshold needed to end the current wave of infection.
Remember, herd immunity threshold is simply the inverse of R0. It is designed for pandemic diseases that can be eliminated through vaccination alone, like smallpox and measles. COVID-19 cannot be eradicated by vaccination alone, similar to influenza.
Herd protection, on the other hand, depends on how many people catch the disease, get vaccinated, have pre-existing immunity, or are excluded by occasional heterogeneous mixing of the population. It temporarily halts epidemic transmission. It does not eliminate the disease.
Herd protection indicates a shift from a regional epidemic to the next phase of the disease. I refer to this as the Transitional Phase, which will be discussed in a later chapter.
Heterogeneous Mixing of the Population
Meanwhile, I glossed over another new idea: the heterogeneous mixing of populations and its impact on attack rate and herd protection.
Some people will contract Covid-19, while others are less likely to do so. Remember, there are still some people in the United States and around the world who haven’t left their homes since the pandemic started. Others leave their homes less than once a week. These individuals mix heterogeneously, meaning they don’t mingle much, which lowers their risk of catching Covid-19. On the other hand, some adults are at beaches and bars, actively socializing. These (often) young individuals have a higher risk of infection—and they will likely get it. If we divide the population in half, we have those at higher risk of contracting Covid-19 and those at lower risk. Once those at higher risk get it, they can’t get it again for at least a few months. They remove themselves from the susceptible pool, making disease spread more difficult. However, the reclusive individuals don’t come out and take their place. Different populations don’t mix randomly, as assumptions about herd immunity might suggest.
Thus, heterogeneous mixing of the population lowers the attack rate but is not taken into account in most models of Covid-19 herd immunity. Social butterflies will become, at the very least, partially immune. Those who continue to isolate at home won’t get Covid-19, which lowers the herd protection threshold. Numbers like R0, and herd immunity derived from it, assume random mixing of people. We don’t mix randomly, but rather with the same people over and over again. And some mix more than others. When we adjust for heterogeneous mixing, the herd protection threshold goes down even more.
Many in the public eye have been focusing on the wrong numbers. They have been looking at R0 and imagining that 60–80% of people would need to get infected in order to reach herd immunity. Instead, we can look at attack rate and see that the back of the epidemic is broken at a much lower percentage of infections. Given heterogeneous mixing of the population, given asymptomatic infections, and given partial immunity, herd immunity is not the right goal.
We will never eradicate Covid-19. Herd protection is the goal. It may be that the herd protection threshold is as low as 10–20%. That is, after 10–20% of people in a region are infected, the epidemic wave may be over for now.