
How to Invest Conservatively for Retirement
If you are retiring soon, you might wonder: How conservatively should I invest? Given the sequence of return risk and the other retirement-specific risks, what asset allocation should I have?
First, let’s look at a 50/50 portfolio’s historical returns. That’s a good place to start when discussing conservative retirement investing.
If you are retiring in the next five years, beyond mitigating sequence of returns risk, it is time to invest conservatively. Given the historical returns of different asset allocations, how conservative are you? Let’s start by discussing what asset allocation means to you.
Asset Allocation in Retirement
If you are drawing down on an equity portfolio with recent negative equity returns, you may run out of money in retirement. While there are many ways to mitigate sequence of returns risk, one tried-and-true method is to make your asset allocation more conservative.
Historical 50/50 Portfolio Returns
Look at recent history and see how a 50/50 asset allocation performs. If you are going conservative—de-risking—a 50/50 portfolio is an excellent place to start.
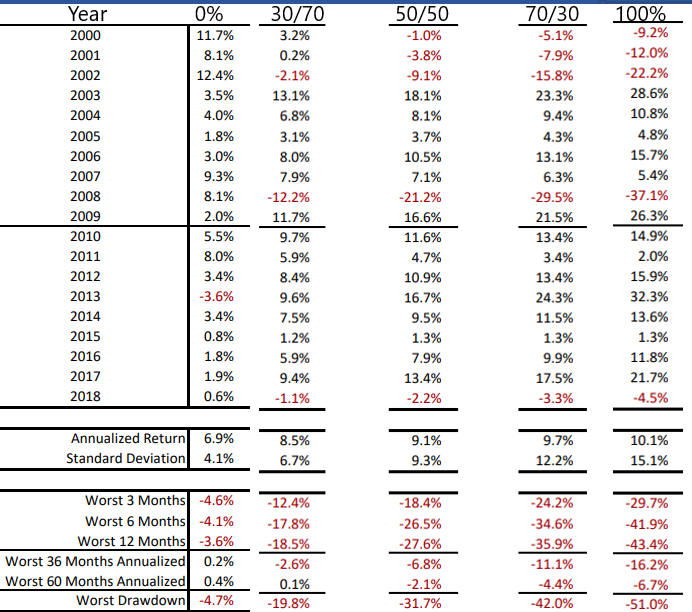
(50/50 Asset Allocation recent returns, annualized return, and worst drawdown)
Figure 1 is busy but informative.
See the top of the figure with returns since 2000. In addition, see the annualized returns, standard deviations, the worst 3-, 6-, and 12-month returns, and the worst drawdowns.
We start with 0% equities (100% treasury bills) on the left and end with 100% equities (S&P 500) on the right. In the middle, asset allocations are 30/70, 50/50, and 70/30.
This is a great way to study expected future comparative returns of a 50/50 portfolio and less and more aggressive asset allocations. Also, most of us can remember this time well, so recency bias is substantial given the two significant recessions in this short period.
Years with Negative Returns since 2000
Note that there are 5 of 18 years when equities had negative returns.
A 100% treasury portfolio avoided all those negative years but had a year (2013) with negative returns. Speaking of recency bias, do you remember what happened to bonds in 2022?
Our least aggressive asset allocation (30/70) avoided 2 of the five negative years, but both the 50/50 and the 70/30 suffered from negative returns in all 5 of the years.
Annualized Return
The annualized return (since 1970) for a 50/50 portfolio is 9.1%. This compares to 9.7% for 70/30 historical portfolio returns and 8.5% for 30/70 portfolio historical returns. Are you surprised that the difference isn’t more significant?
Worst 3-, 6-, and 12-Month Return
You can look at these numbers yourself to compare the different asset allocations. Note how similar the worst 6- and 12-month returns are. On average, it doesn’t get much worse after a terrible six months.
The worst drawdown is the percentage decrease from the top of the market to the bottom. But, again, the market has not gone down much further after six dreadful months. Maybe that is a consideration for when to be greedy (when others are fearful) during corrections.
Worst 36- and 60-Month Annualized Returns
Finally, note the worst 3- and 5- year periods.
Since 1970, a 50/50 portfolio had a 3-year return of -6.8% and a 5-year return of -2.1%. Note how these returns compare to the other listed portfolios.
Summary: Historical Returns of a 50/50 Portfolio
If you are drawing down on your portfolio in the next five years, you must pay attention to known Risks. For example, what should your asset allocation be five years from retirement?
Beyond the known risks, there are the unknown risks and the risks from things we think are true but are not.
Above, we see the historical returns of a 50/50 portfolio and compare them to slightly more or less aggressive asset allocations. Next, the 70/30 portfolio historical returns and the 30/70 portfolio historical returns are not very different: 9.7 and 8.5. Finally, note the worst-case scenarios.
Sequence of Return Risk is inevitable when withdrawing from retirement accounts. So plan your pre-retirement glidepath and “go conservative.” You can be in the game for the long haul with a conservative asset allocation.