Callan Chart 2024: Two Decades in Review
The Callan Chart is evidence that humans are pattern-seeking animals. From Rorschach tests to stuff seen in clouds, we seek to impose structure and design where there is none. So, too, with investors and the Callan Chart.
People try to predict the future by looking at past performance. 2023 is a classic year of performance chasing. What does the Callan Chart of 2024 tell us about future performance chasing?
The Callan Chart ranks annual returns for asset classes over the last two decades. Lessons from the past are plenty for the investor, though the future is insoluble.
Formally known as The Callan Periodic Table of Investment Returns: Year-End 2022, let’s look at the past to see what we can learn about 2024 and beyond.
The Callan Table 2024
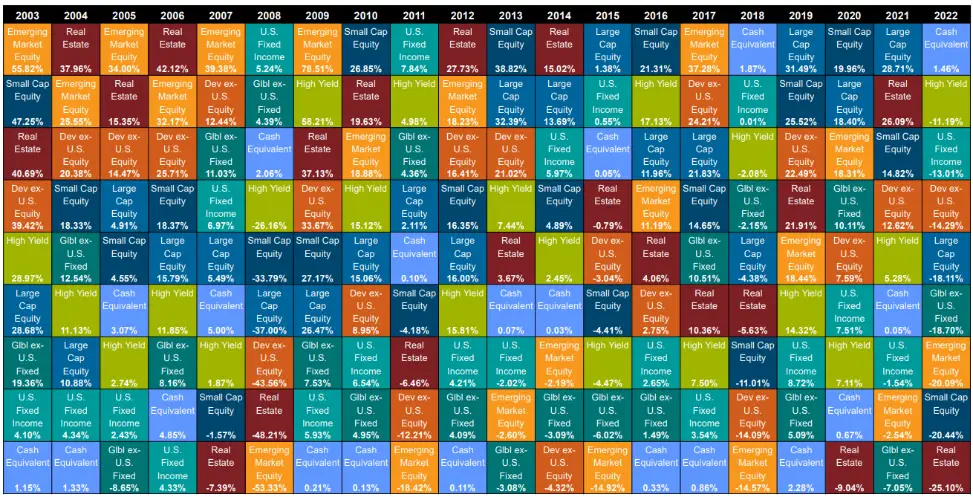
Above, find the Callan Periodic Table in all its glory! Look for trends. Find patterns in the colors. Then, continue reading.
Large Cap Growth has done best. But look at the orange along the top! That is emerging markets.
Patterns are everywhere when you look at the table in the traditional view.
Let’s have a different look at the Callan Periodic Table.
The Callan Periodic Table Ranked Relative to Zero
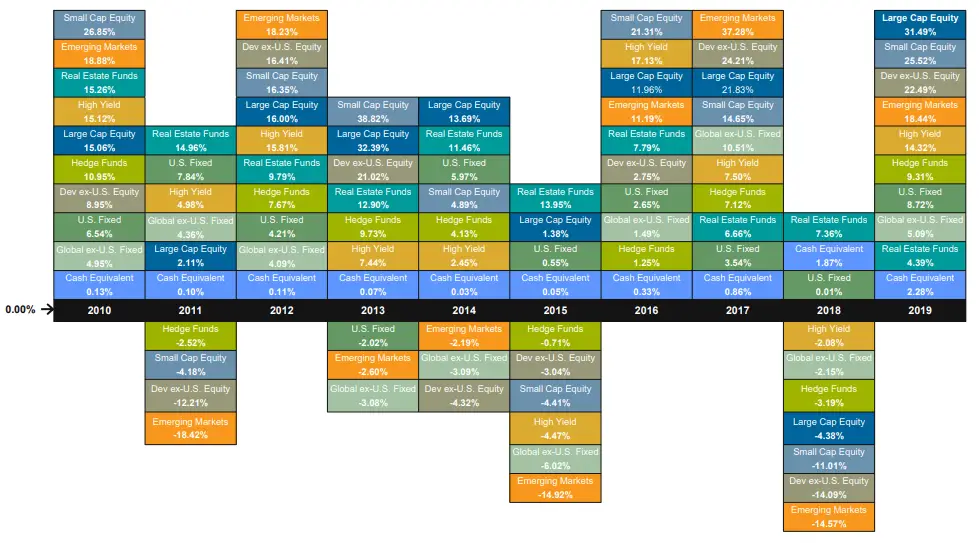
This is a less traditional view of the Callan Periodic Table. The black line dominates this figure: positive returns are above and negative below.
It is more difficult to find patterns in the undulating rows.
What other patterns do you see?
Rank Ordering the Callan Periodic Table
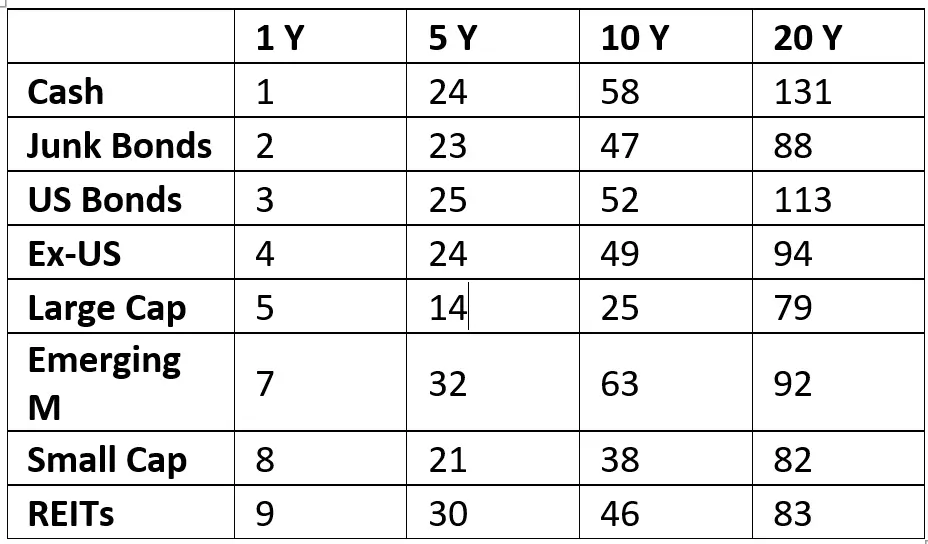
Above, the 1 Y results show you which asset class finished above the others in 2022. The one-year rankings score cash first, junk bonds, US bonds, ex-US, Large Cap, non-US bonds (data not included), and emerging markets, small caps, and REITs finished last in 2022.
Next, I have the 5, 10, and 20-year results; the higher the score, the worse. If they ranked first during one year, they only scored one, but if they ranked 9th, they scored 9. So the lower, the better.
Let’s start with the 20-year results. Large Cap wins (obviously) with a force ranking of 79, while, despite a bad 13 years, Small Cap is number 2 at 82. Despite REITs being destroyed in 2 of the last 3 years and underperforming for 8 years, REITs are number 3.
In the interest of time, I will skip over non-US bonds and go on to equities rated 4, 5, 7, and 8 in 2022. Guess which one did better over the last five, ten, and 20 years? Ex-US, Large Cap, Emerging Markets, or Small Cap, respectively?
Unsurprisingly, Lage Cap wins the race, followed by Small Cap (Factor investing narrows the lead at 20 years). Ex-US and Emerging markets have had poor 5, 10, and 20-year results. Come on, the rest of the world… start carrying your weight in this capitalistic system!
Rank Order The Callan Table a Decade Ago
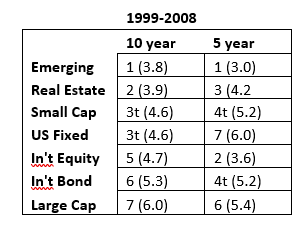
Going back another decade, the rank order of asset class returns is quite different.
If you were in 2009 and looked back a decade at the Callan Chart returns, you would have a different recency bias.
Back then, EM had the best 10-year history, followed by REITs and Small Cap. In 2009, US Bonds had a decent 5-year track record but finished last over ten years (this is the 40-year interest rate cycle that supported bond prices over yields).
Finally, in 2009, Ex-US had the second-best 10-year returns, and large-cap had the worst five and second-worst 10-year returns.
What a difference a decade makes.
Callan Chart 2024: Two Decades in Review
What can we learn about the future by looking at two decades in review via the Callan Chart?
Lesson 1:
Nobody knows which horse is going to win this year’s race. There is no future predictive value of the Callan Periodic Table. Don’t buy last year’s winners.
Predicting the future is easy: no one can do it.
Lesson 2:
Diversification leads to lower returns but higher risk-adjusted returns. People often get this wrong. They think diversification leads to higher returns. Concentration—in the right funds—leads to higher returns. This is why owners of winning companies are the wealthiest people around. However, diversification leads to higher risk-adjusted returns.
You want to own all the winners all the time permanently and never sell. Diversification is the only free lunch.
Lesson 3:
Rebalance! This is a tricky one. Rebalancing too often stunts growth. But eventually, winners revert to the mean. Momentum is real, but look back a decade ago and consider what momentum was then.
You decide if you should rebalance.
Lesson 4:
Chase performance! Unfortunately, most investors follow this advice. They invest in last year’s winners.
Momentum is important. You can get greater returns on the back of last year’s winners until a certain point. Stay invested all the time because market timing is foolish.
Lesson 5:
Don’t be underweight what isn’t sexy
Stick to your guns. Keep up your programmed investments, including those underperforming.
Investing Prediction for 2024 Based Upon the Callan Periodic Table
Stocks and bonds will go up and down. As a result, some people will make money, and some will lose money.
Who knows with more certainty than that? The Callan Periodic Table of Investment Returns doesn’t.
When looking at the Callan Chart, don’t look for trends; rather, see principles.