Cash Flow Index vs Debt Snowball?
Cash flow index. Who knew there was a third strategy for debt repayment?
Traditionally, Dave Ramsey’s followers subscribe to the debt snowball in which the smallest debts are paid first to free up money and attack increasingly larger debts. This strategy has momentum and psychology behind it.
Alternatively, the debt avalanche pays off the highest interest rate debts first and lower interest rates subsequently. Mathematically, this makes the most sense and costs the least.
Finally, if you don’t know Dave or math, the default method is to split payment equally between all debts. Pay a little extra on each debt if you have a windfall or extra money. Let’s call this the debt flood. It’s not a great idea, as we will see below.
I just learned about a method called the Cash Flow Index. The point of the Cash Flow Index is to pay off inefficient debt. Huh… debt can be efficient? That sounds like mortgage acceleration or something!
Let’s look at a theoretical debt payment scenario for a doctor (let’s call her Dr. Debt) and her husband to see how each model works.
Cash Flow Index in Action
Dr. Debt earns $260,000 a year, and she and her husband continue to live like residents to pay off debt. Their fixed costs before debt are about $60,000 yearly, but they are not the world’s best budgeters. In reviewing cash flows, about $8,000 goes missing a year.
They are good savers, however, and max out their contributions to a 401k with a 6% match. They also contribute $6,000 yearly to a backdoor Roth and $6,000 yearly to a brokerage account. All investments are in a total stock market index fund with low expense ratios.
Monthly debt service costs are $7,896.
| Debt | Payment | Min Payment | Amount Owed |
| Car loan 5% | 300 | 300 | 10,000 |
| Credit Card 19% | 1000 | 250 | 50,000 |
| Personal 10% | 4000 | 800 | 100,000 |
| Student loan 4% | 900 | 900 | 150,000 |
| Mortgage 4.125% | 1696 | 1696 | 330,000 |
Figure 1 (list of Debts)
Figure 1 above lists their debts from smallest to largest, with associated interest rates. They have a car loan, a credit card, a personal loan, refinanced med school debt, and a home mortgage. Payments and minimum payments are shown. They pay extra on credit cards.
The Three Debt Repayment Models
Let’s look at the three traditional ways to pay off debt first.
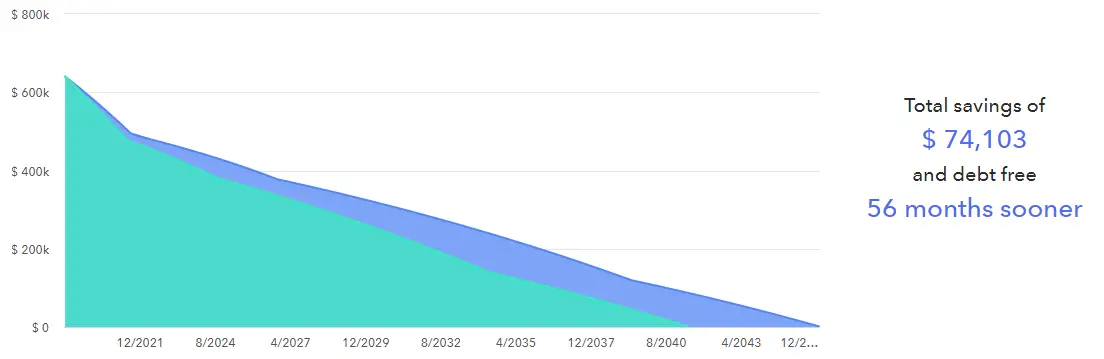
Figure 2 (balance of debt with additional payments)
Figure 2 shows their debt balance with no additional payments (in blue). Their debt will take almost 30 years to pay off. If they add an extra $1,000 a month “debt flood” (shown in teal), payments are applied to all accounts, and they get out of debt 56 months sooner and save over $74,000. Wow.
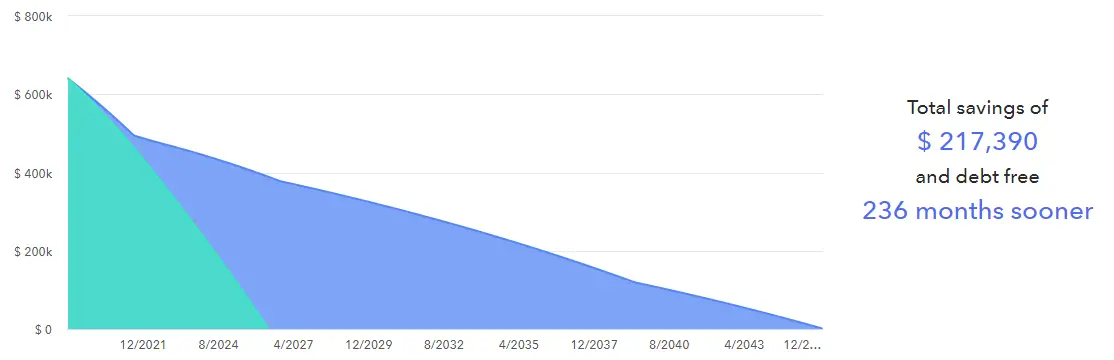
Figure 3 (the debt snowball)
Dave is on to something! Using that extra $1,000 a month (Figure 3) to pay their debt from smallest to largest saves over $217,000, and they get out of debt 19-and-a-half years earlier. Roll debt snowball!
Using the debt avalanche (not shown, but similar to the debt snowball), we see that the math nerds are right. In this example, the couple is debt-free 237 months sooner, and they save $220,709— $3,391 more than the debt snowball, or about $170 a year in savings. Not much better than the snowball.
Up Close with the Debt Snowball vs. Cash Flow Index
Let’s look at how the different models pay off debt.
| Debt | Snow-ball | Balance and Payoff | Aval-anche | Balance and Payoff | CFI | Balance and Payoff |
| Car 5% | 1 | 10,000 @1300/m 7.7m | 3 | 2616 @6300/m 0.5m | 2
(33) |
4,609@5300/m 0.9m |
| Card 19% | 2 | 48,026 @2300/m 20.8m | 1 | 50,000 @2000/m 25m | 3
(50) |
43,783@6300/m 6.9m |
| Personal 10% | 3 | 0 @6300/m | 2 | 11,784 @6000/m 2m | 1
(25) |
100,000@5000/m 20m |
| Student 4% | 4 | 138,029@7200/m 19.2m | 5 | 120,433@8896/m 13.5m | 4
(167) |
138,476@7200/m 19.2m |
| Home 4.125% | 5 | 300,731 @8896/m 33.8m | 4 | 314,131@7996/m 39.3m | 5
(195) |
301,391 8896/m 33.9m |
| Months (first 3) | 28.5m | 27.5m | 27.8m | |||
| Months (all 5) | 81.5m | 80.3m | 80.9 |
Figure 4 (order of payoff and debt balances at the time the debt is paid above the minimum)
Figure 4 lists the payoff order for snowball, avalanche, and Cash Flow Index (CFI). Note that the order of the first three payments differs: the avalanche pays off the home loans before student loans because the interest rate is slightly higher.
The remaining balance is shown when the debt exceeds the minimum payment. Also shown is how long it takes to eliminate the debt with just the minimum payment plus the $1000 extra payment (plus the addition of the next minimum payment as the next debt is addressed).
The number of months it takes to pay off the first three and all five debts is also shown.
For the snowball, 7.7 months are spent paying off the smallest debt, which then rolls to the second largest debt for 20.8 months. By then, the personal loan had already been paid off due to large minimum payments, so debt payment moved to the student loan and then the mortgage.
In the avalanche, 25 months are spent on the first debt, the high-interest credit card. The personal loan is next, followed by the car, mortgage, and student loan.
The CFIs are shown in parentheses under the rank number.
What is the Cash Flow Index?
The cash flow index is calculated by dividing the total debt by the minimum monthly payment.
Debts with a low Cash Flow Index are considered inefficient and should be paid off first.
Look at the numerator of the CFI calculation: the higher the debt, the higher the CFI will be and the less priority to pay it off. The denominator has an inverse relationship: the larger your minimum payment, the lower the CFI. Low CFIs are considered inefficient and should be paid off.
In other words, if the minimum payment is high, you will get more cash flow if you prioritize paying it off rather than focusing on APR. Conversely, if the total debt is high, it will take a long time to pay off the loan and increase cash flow, so the Cash Flow Index is high or efficient and should not be paid off early.
With the Cash Flow Index, debt repayment begins with the lowest CFI number and proceeds up.
Specifically, a CFI less than 50 is considered critical debt, which is inefficient and should be paid off. Debt with a CFI between 50 and 100 is borderline and may be paid off to free up cash flow or restructured. Debt with a CFI greater than 100 should not be paid off, as it is an efficient debt and will not lead to increased cash flow in the short term.
A goal of debt repayment via CFI is not to pay off your efficient debts—those with CFIs >100. This cash flow can be better used by investing in other assets such as businesses (or, for the creators of CFI, cash value life insurance). Huh.
Back to the Example of the Cash Flow Index
Let’s return to Figure 4 and discuss the Cash Flow Index. The personal loan is paid off first as it is the least efficient with a 25 CFI. Unfortunately, it is a large loan and takes 20 months to pay off. Next is the car debt (CFI 33), and then, after all that is paid off, the 19% APR credit card is handled.
The score of 50 suggests the credit card should be refinanced to a lower-interest credit card, and 50 isn’t even the real number. If we reflect on Figure 1, the actual minimum payment is $250 a month, giving it a CFI of 200, which makes it the most efficient debt on the list. That doesn’t make sense to me as that puts you in the freedom zone and suggests you should never pay off that debt. Huh… never pay off a debt compounding at 19%. That is a quick way to the poor house! You can’t ignore the interest rate in all situations.
Rate of Return (on Loans)
Another calculation can be done when considering the CFI. The rate of return on a loan is calculated as minimum payment x 12 divided by the loan balance.
| Debt | CFI rank | Payment | Amount Owed | CFI | Rate of Return |
| Personal 10% | 1 | 4000 | 100,000 | 25 | 48% |
| Car 5% | 2 | 300 | 10,000 | 33 | 36% |
| Card 19% | 3 | 1000 | 50,000 | 50 | 24% |
| Student 4% | 4 | 900 | 150,000 | 167 | 7% |
| Home 4.125% | 5 | 1696 | 330,000 | 195 | 6% |
Figure 5 (CFI rank, CFI, and Rate of Return)
Figure 5 shows the CFI rank, the CFI, and the rate of return. If you had $100,000, you could pay off the personal debt, which would free up $4000 a month and lead to a rate of return of 48% on your “investment.” That makes sense. Using $10,000 to pay off your car loan would lead to a rate of return of 36% on your money, or $300 a month. For efficient loans, the rate of return is in the single digits, which means not much cash flow from paying off these debts.
Another Example of the Cash Flow Index
Let’s look at another example.
| Debt | CFI rank | CFI | Payment | Amount owed | Rate of return |
| Car 0% | 1 | 10 | 1000 | 10,000 | 120% |
| Card 10% | 2 | 40 | 250 | 10,000 | 30% |
Figure 6 (another example of the Cash Flow Index)
Here, in Figure 6, you pay off the 0% loan because the rate of return is 120%, which is less efficient. In this example, your car is paid off after a few months if you throw extra money at it. This frees up the $1000 monthly payment, allowing you to rapidly snowball the credit card with your increased cash flow. But, if you delay paying the credit card, you could be stuck with $1000 in interest payments for the year to allow that increase in cash flow. Maybe CFI isn’t a great plan.
Loan Efficiency and Control
The point of CFI: it allows you to control cash flow better. The creators of CFI suggest (after an emergency fund) stockpiling your cash and then paying off debts in order of efficiency when you can make lump sum payments. Then, go back to saving cash again. This does afford greater security by having liquid assets around if needed.
As to the efficiency of loans, if there are large balances or low relative minimum payments, the loan likely has a CFI greater than 100 and is considered efficient. I’m not sure that is the word I would pick, though. Maybe “expensive”: a big-ass loan that would take too long to pay off and not free up the cash flow to make it worth it.
Summary: Cash Flow Index vs Debt Snowball
Cash Flow Index models another way to consider debt repayment vs the debt snowball.
Criticism of Dave Ramsey (aside from suggesting you pay down debt rather than take a match on a 401k) includes ignoring interest rates as you pay the smallest debt first and snowball your way up the hierarchy of debts. Dave says it is about behavior, not math. If you could do the math, you wouldn’t be in debt in the first place. As evidenced above, there is little difference between the snowball and avalanche.
The Cash Flow Index also ignores interest rates, placing high importance on obtaining cash flow quickly so you can meet investment priorities and control your finances more. Given who created this index, I fear that the priorities are cash value life insurance and using this insurance to “bank on yourself.”
As shown in our original example, I’m not impressed with the rapidity with which you have higher cash flows with CFI. After 20 months, you can pay $ 5,300 monthly to continue paying debts. Of course, this will vary by loan amount and minimum payment.
In summary, the Cash Flow Index is an interesting idea, but there may be a reason few people have heard of it, and financial planning software doesn’t bother modeling it.