
Rising Equity Glide Paths and Early Retirement
Rising Equity Glide Paths are an important consideration for those facing early retirement. You have a long horizon, so you want to be aggressive. This, however, sets you up for sequence of returns risk.
There is nothing traditional about a 60-year retirement. Everything is different. Can a rising equity glide path help you combat sequence of return risk?
Rising Equity Glide Path
Kitces and Pfau are known names in the financial planning world. Both have studied rising equity glide paths. They admit a 60/40 portfolio is just about as good as anything else for traditional retirement.
Their model glide path, however, has been criticized. They use a 30/70 stock-to-bond portfolio at retirement that increases slowly to 60/40. They note that “there’s still far more research to be done to optimize the exact shape and slope of the … glide path.”
ERN at Early Retirement Now has done some advanced modeling for rising equity glide paths, especially for 60-year retirements.
ERN criticizes Kitces and Pfau for using Monte Carlo simulation, where he uses historical data. He goes on to say:
Unless we believe that the past observed dynamics of equity returns no longer apply in the future, we should disregard the Kitces/Pfau glide paths because they’d likely perform worse than even most static asset allocations.
He suggests that glide paths rapidly increasing from 60% to 100% equity are more successful over long periods.
So, what is the ideal glide path for early retirement?
Modeling Rising Equity Glide Paths for Early Retirement
For this simulation, asset allocation decreases to 60/40 five years before retirement. Sequence Of Return Risk is highest five years before to 10 years after a 30-year retirement. I will look at two different glide paths. First, Glide10 increases from 60/40 to 90/10 over ten years. I picked 90/10 rather than 100% stocks to maintain some diversification over the long haul.
Second, Glide20 increases from 60/40 to 90/10 over 20 years.
Also, future dollars will be used. Though inflation is assumed to be 2% annually, future dollar results represent the future value of present-day dollars. Sixty years is a long time for inflation and compounding to interact and sums worth $1M now seem absurd to present eyes.
Assume a $1M portfolio invested in US stocks and bonds. Upon early retirement at 30 years of age, a 3.5% %-a-year withdrawal rate is used and adjusted by inflation. The simulation ends at 90 years of age, 60 years post-retirement.
I simulate SORR (sequence of returns risk) by the actual stock and bond returns from 2000-2010. Before or after, assume stocks and bonds return 9% and 5%, respectively. Below, I also briefly look at lower assumed returns (7% and 3.5%, respectively).
Results of the Models
Assuming 9% stock and 5% bond returns, let’s look at the results.
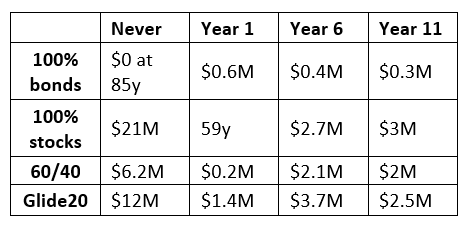
Figure 1 (Portfolios with SORR timing)
On the left, you see four different types of portfolios: 100% bonds, 100% stocks, 60/40, and Glide20.
On the top—when SORR starts—never, or at year 1, 6, or 11 from retirement.
How do these portfolios perform if SORR never arrives? The higher the stock allocation in a fixed-increasing environment, the better. Bonds expire after 85 years, and stocks do great.
But next, let’s see what happens if you retire at the worst possible time.
SORR at Year One
What if a bear market lasts three years and another significant decline in year nine?
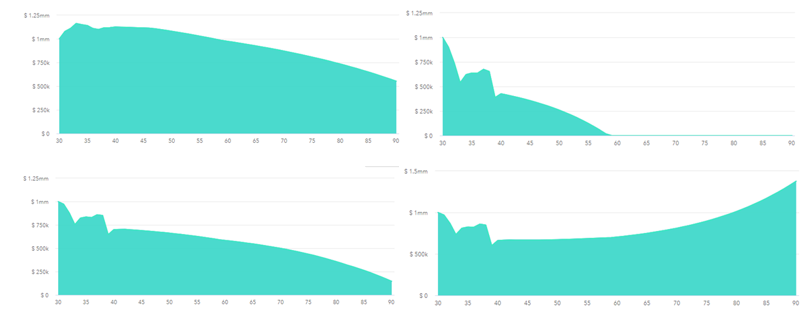
Figure 2 (100% bonds, 100% stocks, 60/40, Glide 20. SORR starts at year one)
Above, the x-axis is age 30-90, and the y-axis is portfolio size.
SORR at year one devastates 100% stocks (top right), but 100% bonds (top left) ends the ten years with $0.6M (again, future dollars).
On the bottom left is the 60/40 portfolio. Glide20 is bottom right.
Note Glide20 has an increasing slope to the tail, and 60/40 decreases over time. As a result, glide20 wins this round with $1.4M, and the 60/40 portfolio has $0.2M.
What if SORR arrives later?
SORR at Year Six
What if the nasty 10-year sequence starts at year six?
As seen back in Figure 1, Glide20 is the winner again.
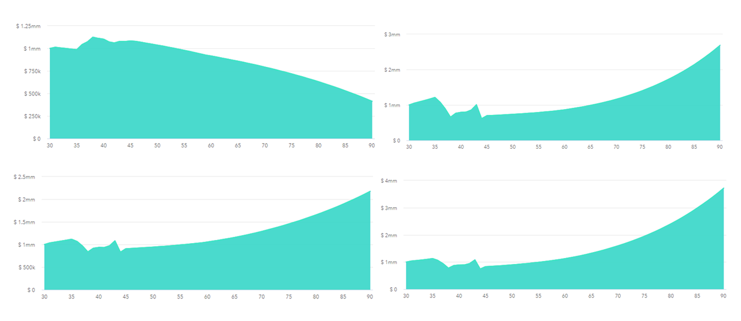
Figure 3 (100% bonds, 100% stocks, 60/40, Glide 20. SORR at year six.)
Note that the money scale on the left is different for all pictures.
Again, find 100% bonds top left and 100% bonds top right. They end up with $0.4m and $2.7M, respectively.
Find the 60/40 portfolio on the bottom left and Glide20 on the right. 60/40 has $2.1M vs. $3.7M for Glide20.
SORR at Year 11
Looking at Figure 1, a 100% bond portfolio didn’t do well. When SORR is delayed in a lengthy retirement, the higher the stocks, the better you do. In this case, 100% stocks returned $3M, Glide20 $2.5M, and 60/40 $2M.
What Happened to Glide10?
Glide20 beat Glide10 in all situations for low and high expected returns aside from when SORR was not present. This is below.
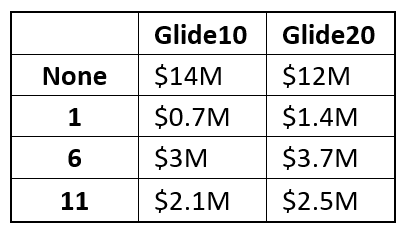
Figure 4 (Comparison of Glide10 and Glide20 with the presence of SORR)
So, Does Glide20 beat a Fixed 60/40 Portfolio?
Yes.
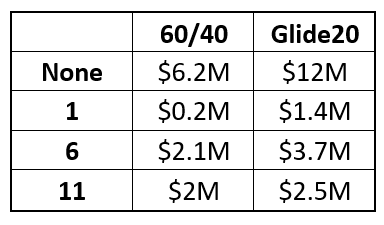
Comparison of 60/40 and Glide20 with the presence of SORR
Over 60 years, Glide20 beats a fixed 60/40 portfolio with no SORR and with SORR at years 1, 6, or 11.
Can a 3.25% Rate Save the Low Return Scenario?
When I modeled SORR with low return assumptions (stocks 7% and bonds 3.5%), a 3.5% SWR did not survive any of the scenarios. Due to these depressing results, I looked at a 3.25% rate rather than a 3.5% rate.
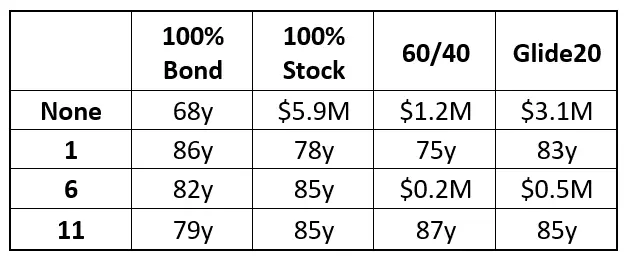
Figure 6 (Comparison of the different portfolios with a 3.25% SWR rather than a 3.5%)
As seen above, none of the portfolios survive if SORR arrives at year 1 or 11. With low assumed rates of return for stocks and bonds, Glide20 does a bit better than 60/40, except with SORR arriving at year 11. Even a 3.25% rate can’t save a 60-year portfolio against SORR with long-term low assumed rates of return. Remember that 3.25% is the safe withdrawal rate for early retirement rather than 4%.
Lesions Learned from Different Models of Rising Equity Glide Paths
In this scenario modeling different Rising Equity Glide Paths, Glide20 beat Glide10 in all scenarios with Sequence Of Return Risk. So perhaps it would be interesting to see what Glide15 does against Glide20. Indeed, as ERN points out, a Glide30 is not ideal.
In addition, returns matter. In this scenario, assumed 7% stock/3.5% bond returns failed miserably for all portfolios with a 3.5% withdrawal rate, and a 3.25% rate didn’t help this much. However, all portfolios did much better when returns were assumed to be 9% for stocks and 5% for bonds. As we know, small changes over significant periods result in considerable improvements in outcomes.
In this scenario, both Glide10 and Glide20 beat a fixed 60/40 portfolio.
A rising equity glide path for early retirement may be just the ticket. However, remember that your personalized glide path before retirement can have programmatic changes in asset allocation, and that is not market timing.
The academic literature on the topic is sparse, but remember that there are no data to suggest that rebalancing in retirement is beneficial (aside from controlling a portfolio’s risk and volatility).