How Often Does the Yield Curve Stay Inverted for 2 Years?
The yield curve has been inverted for two years, and we have not had a recession. How common is the yield curve to be inverted for so long?
Let’s discuss the implications for the yield curve to be elevated for two years.
What is an Inverted Yield Curve?
An inversion of the yield curve means that shorter-duration treasuries (3 months, sometimes two years) pay more than longer-duration ones (10-year treasuries). Historically, recessions follow 6-18 months after an inversion, which is why we have been expecting one for a while now.
Currently, the yield curve has been inverted for two years. Is that a long time?
How Many Months Is the Yield Curve Usually Inverted?
So, how many months is the yield curve usually inverted?
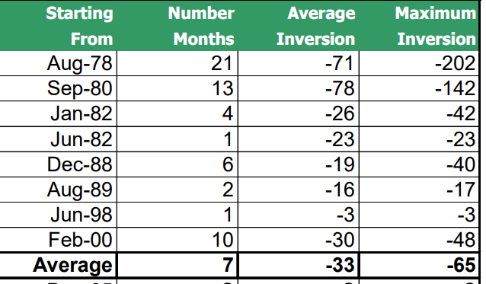
Above is Bloomberg data from 2005 (2M and—10Y) showing that the average yield curve inversion lasts seven months but ranges from 1 to 21. In 1978, the 21-month inversion was quite an outlier; only 3 of the eight inversions lasted more than 10 months.
So, two years puts us at the longest yield curve inversion since we went off the gold standard.
The average and maximum inversion above is the number of basis points different, so the average of 33 basis points and the maximum average of 65 basis points are 0.33% and 0.65% different, respectively.
The current inversion is around 40ish and has been as big as 188.
Recessions usually lag yield curve inversions by 6-18 months; we might still be in for a not-so-soft landing.
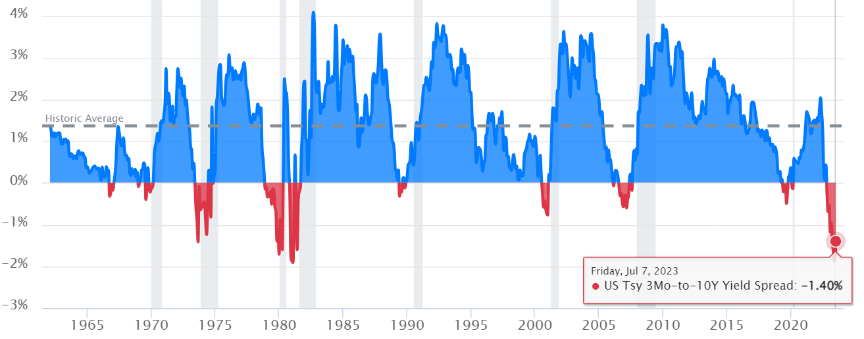
Above (currentmarketevaluations.com), you can see when the curve is inverted (3-m 10-y), and the grey bars are recessions. This is when talking about yield curves gets messy because this data (using the 3 and 10 vs. 2 and 10) shows the depth of the 1980 and 1982 inversions deeper than the ’78 one. This is not what we see in the data above, but remember, there are lies, damn lies, and statistics. Torture the data until it tells the story.
The story is that this inversion has been deep and long—the longest yield curve inversion in modern history. Considering modern fed policy, looking at data before coming off the gold standard is not interesting. With their fed fund rate, they push the rope to try and get borrowing costs to control the velocity of money and the economy’s growth. They have no levers to pull, just a rope to push around. Some compare the fed’s fund rate to a leash on a dog. The dog can go up and down but stays bound by the leash. The dog is the actual bond yield, and the leash at least directionally controls how far it can wander.
I also have blogs on why we want inflation (it is better than the alternative) and about sequence of inflation risk.