Guardrails vs Other Withdrawal Strategies
I’ve spent some time looking at withdrawal strategies during the spend-down phase of retirement. The planning software allows me to model several versions, including Guardrails, Floor and Ceiling, and also let future spending be inflation-adjusted, or the retirement spending smile, or retirement spending stages.
Let’s examine some hypothetical retirees to determine which withdrawal strategy is better and how future spending affects the plan.
Withdrawal Strategy Scenario
For this scenario, I use a retired couple of 65/63 with a net worth of $3.8M: $1M in brokerage assets and $2.8M in IRAs. The younger couple takes Social Security at 62, and the higher-income earner (who is older) takes it at 70.
Using the normal inflation-adjusted spending (2%, but healthcare is 5%), Monte Carlo odds of success are 68%. The amount left at the end of the plan (the legacy amount) is $2.5M.

Monte Carlo Odds of Success and Legacy Amount
We will compare this plan as a baseline, but to show you a couple of other pictures first:

Above, you can see the initial withdrawal rate is about 4%, and 27.5% of the income is stable (from social security in this case, but it would also include pensions and annuity income). Finally:

Above, you can see the total retirement spending and its causes (dark blue = retirement expenses, light blue = taxes, green = health care). Total retirement spending is calculated at $7.9M.
That’s enough pictures for now. Let’s look at the summary table.
Results of Withdrawal Strategies
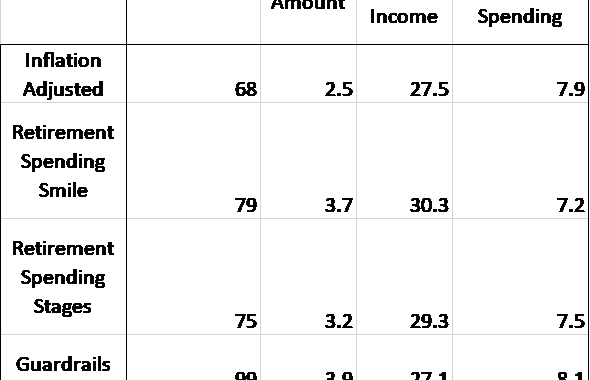
I looked at the same data for the other withdrawal strategies and future planning expenses, and this is the results table.

Results Table
Above, you can see (from top Left to Right) Monte Carlo Odds of Success, Legacy Amount, Percent of Stable Income, and Total Retirement Spending.
We look at the normal inflation-adjusted plan, the Retirement Spending Smile, Retirement Spending Stages, Guardrails, and Floor and Ceiling. Definitions are below.
As for modeling inflation, it looks like the Spending Smile performs better than Stages.
As for the withdrawal strategies, Guardrails won by a mile. Please spend a minute with the numbers on the table.
Next, we will examine the above in more detail to understand what’s behind the scenes and why that changed the data.
Models for Retirement Spending
Retirement Spending Smile
In this planning software, inflation is assumed to be about 2.5% (2%, except for healthcare at 5%). Using the spending smile, inflation is assumed to be about 1% less a year, or 1.5%. This is consistent with spending in retirement, which goes down.
Retirement Spending Stages
Since the decrease in actual spending is not linear, as is assumed with the spending smile, you can use stages. In the go-go phase, you use normal spending. Then, during the slow-go phase, spending is decreased by 10%. The no-go phase is about the last five years of life, and spending is reduced by 5%.
Note that the Spending Smile had better Monte Carlo adds and leaves a larger legacy, but the total retirement spending is also assumed to be the lowest. You could make stages win in this competition by changing the number of years and the percent deduction for the different stages.
Withdrawal Strategies
Guardrails
The Guardrails approach uses market returns to put upper and lower limits on the withdrawal rate. In this program, the withdrawal rate is calculated and then can drift up 10% if the withdrawal rate decreases by 20% compared to the initial withdrawal rate. Spending is decreased by 10% if the withdrawal rate increases by 20%.
Compared to every other option, Guardrails increased Monte Carlo Odds, the Legacy Amount, and allowed the most spending in retirement.
If you agree with variable spending, there is much to be said about the guardrails approach. A 10% haircut in a year might hurt, especially if you have many fixed costs and a low percentage of stable income.
Floor And Ceiling
Finally, for academic interest, the Floor and Ceiling model has a ceiling rate of 20% and a floor rate of 15%. This allows you to grow your spending up to 20% more if the market returns are good, and you have to lower your spending by up to 15% if market returns are poor.
Summary — Withdrawal Strategies Modeled on Planning Software
So you see, at least with the current assumptions written in the software, my planning program likes the spending smile to address spending in retirement and Guardrails to improve Monte Carlo odds and allow you to spend more if the market does well.
Everyone is a little different, of course, and some people don’t like the idea of possibly cutting their spending. This can be especially tricky if you don’t have a high percentage of stable income or high fixed costs.
Guardrails is an interesting approach if your initial withdrawal rate worries you and you want to improve your chances of success (i.e., not running out of money in retirement).
As for modeling inflation, I like to use the Spending Smile, especially if clients aggressively estimate their expenses. Spending goes down in retirement in stages, and starting with aggressive spending, knowing it will taper off seems reasonable.
