
Bond Tents for Retirement Asset Allocation
Bond tents and Rising Equity Glidepaths are styles of glidepaths.
Glidepaths describe the modulation of asset allocation before and after retirement. For example, traditional target-date funds decrease the stock percentage to or through retirement and retain a conservative—mostly bond—portfolio afterward.
Your own personal glidepath does not need to follow a traditional approach. No data or studies support a best practice. However, certain specific glidepaths aim to tame the fiercest foe faced early in retirement: sequence of returns risk.
Sequence of Returns Risk
A nest egg is most vulnerable to sequence of returns risk (SORR) five years before and ten years after retirement. SORR describes the long-term detrimental effects initial negative market returns have on portfolios during de-accumulation. When withdrawing from retirement accounts, selling low locks in losses.
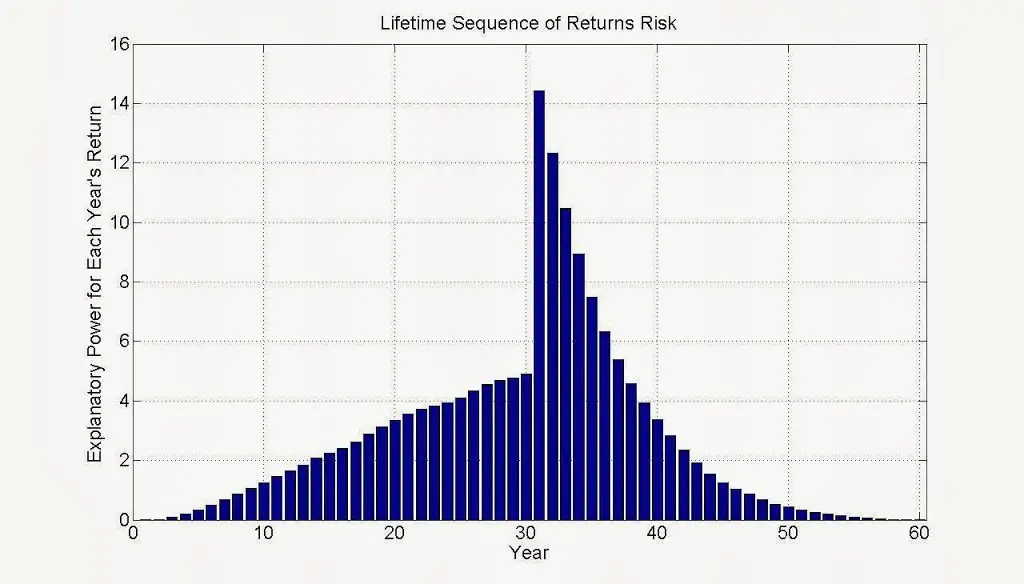
Figure 1
The above graph demonstrates the explanatory power of each year’s return before and after retirement.
Before retirement (which happens in year 30 in this graph), Sequence of Returns Risk increases steadily. SORR peaks dramatically upon retirement and evaporates over 10-15 years.
Since SORR rapidly wanes after retirement, a bond tent might provide additional market returns. These programmatic increases in stock allocations over time positively affect rising tail sequences and may deliver more extensive portfolios.
That is, after SORR passes, more stocks mean you leave more money when you die.
What is a Bond Tent?
With a rising equity glidepath, you increase stock allocation gradually over several years during retirement.
However, psychologically, it is challenging to lead an 80-year-old into more aggressive asset allocations. Perhaps for this reason, attention shifted to bond tents.
What is a bond tent?
A bond tent describes an asset allocation in which the bond percentage increases before retirement and decreases, forming an inverted ‘V’ or a tent. Bonds are prescribed as a volatility dampener to reduce SORR.
Perhaps it is easier to talk a 60-year-old into increasing their bond allocation than an 80-year-old into increasing stock allocation. Thus, the bond tent rather than the alternative.
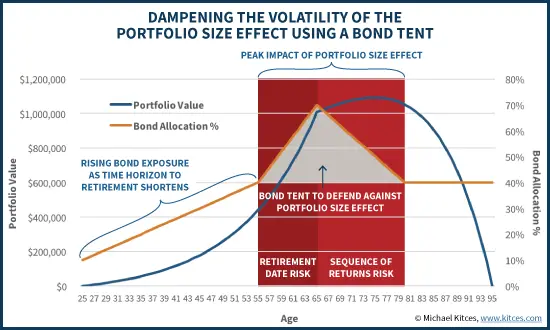
Figure 2
Bond Tents for Retirement
So, do you need a bond tent in retirement?
What asset allocation is ideal before, during, and after retirement to prevent your nest egg from expiring before you do? Or, if you have legacy or charitable goals, is there a way to juice your returns?
Let’s compare a couple of different bond tent styles with a standard 60/40 stocks-to-bonds portfolio and see how they perform under stress from SORR.
Case Presentation and Assumptions
Assume you have a $2M portfolio invested in US stocks and bonds. Let’s use a 4% withdrawal rate and adjust for 2% inflation.
Actual stock and bond returns from 2000-2010 simulate SORR in this example. Before and after these ten years, assume stocks and bonds return either 7% and 3.5% (low returns) or 9% and 5% (high returns).
Results Without SORR
What if there is no bear market during retirement?
7/3.5 (low) 9/5 (high)
100% bonds $0 $0.3M
100% stocks $2.3M $6.7M
60/40 $1M $4M
Glide10 $1.6M $5.4M
Glide20 $1.5M $4.9M
Figure 3 (Results without SORR)
Above, you can see the expected portfolio size after 30 years without market crashes. Both return assumptions (7% and 3.5% for stocks and bonds, respectively, and 9% and 5%) are shown.
Bonds perform poorly, and stocks perform best when assets rise continuously. Comparing a fixed 60/40 portfolio with a 10- or 20-year glidepath demonstrates similar results. Glide10 and Glide20 do better than 60/40 as they have higher stock allocations. As you might assume, Glide10 takes ten years for the bond tent to “resolve,” and Glide20 takes 20 years.
Types of Bond Tents
This model’s asset allocation is decreased to 60/40 five years before retirement. It is held there until retirement and increases incrementally to 90/10 over 10 (Glide10) or 20 (Glide20) years after retirement.
A quick note about future expected returns: I demonstrate two different returns. In this scenario, using harsh 2000-2010 returns to model SORR, I wanted low expected returns (7% for stocks, 3.5% for bonds) and higher expected returns (9% for stocks, 5% for bonds). Expected returns may likely be higher following significantly low returns, but take your pick.
SORR at Year One
What if there is a bear in year one?
7/3.5 9/5
100% bonds $1.4M $2.2M
100% stocks $0 at 20 years $0 at 22 years
60/40 $0 at 30 years $0.7M
Glide10 $0 at 30 years $0.6M
Glide20 $0 at 30 years $1M
Figure 4 (Results with SORR at year one)
Above, you see the results when disaster strikes the year of retirement. This represents the largest risk to your portfolio’s future, according to Figure 1.
The 100% bond portfolio does the best in this scenario. The 100% stock portfolio survives 20 or 22 years, depending on return assumptions.
Using the lower return assumptions (7% and 3.5%), none of the other portfolios survive at year 30. However, with higher return assumptions, 60/40 and Glide10 do pretty similarly, and Glide20 does better.
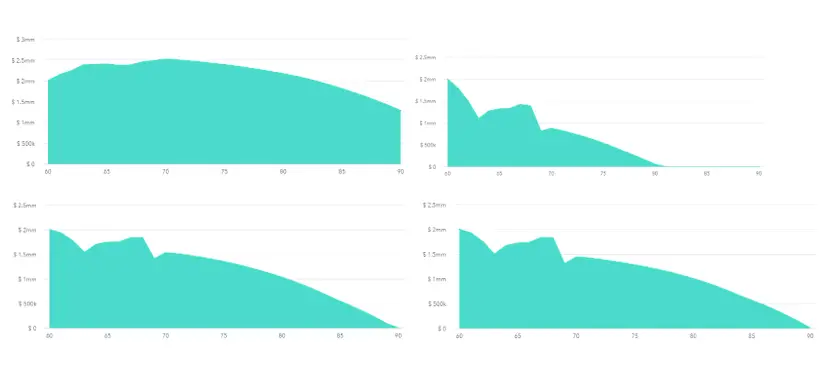
Figure 5 (100% bonds, 100% stocks, 60/40, Glide20. SORR at year one, low assumed return rates)
Visualizing these portfolios with the low assumed return rates, we see 100% bonds (top left) and 100% stocks (top right). There is not much to be said about that. Note that years (60-90) are on the x-axis, and portfolio size is on the y-axis.
The 60/40 portfolio (bottom left) has slightly more left after SORR, though the slope of decline after is more rapid than Glide20 (bottom right).
Let’s continue looking at SORR starting at different periods after retirement.
What about SORR Later in Retirement?
What if there is a bear in year six?
7/3.5 9/5
100% bonds $0.9M $2.1M
100% stocks $0.1M $1.7M
60/40 $0.8M $2.4M
Glide10 $0.5M $2.1M
Glide20 $0.7M $2.5M
Figure 6 (SORR starting at six years after retirement)
As seen above, when SORR starts at year 6, an all-stock portfolio performs poorly again.
All the other portfolios perform about the same, with 100% bonds winning with low return assumptions and Glide20 just edging out 60/40 with high return assumptions.
What if there is a bear in year eleven?
7/3.5 9/5
100% bonds $0.6M $1.9M
100% stocks $0.2M $2.1M
60/40 $0.7M $2.4M
Glide10 $0.3M $1.9M
Glide20 $0.4M $2.1M
Figure 7 (SORR starting 11 years after retirement)
SORR starts at year 11 above. The 60/40 portfolio beats both Glide portfolios despite return assumptions in this setting. This can be visualized below.
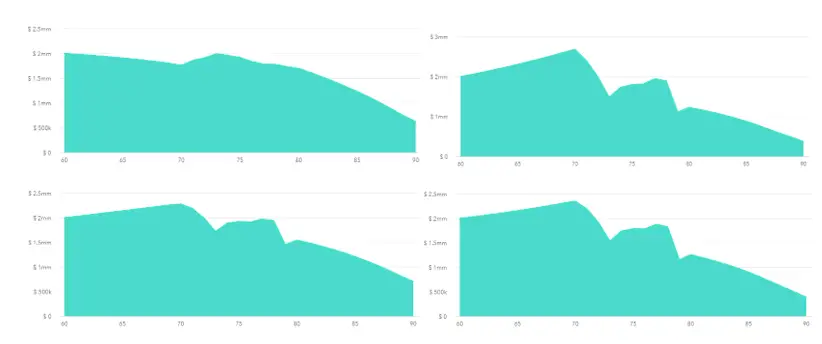
Figure 8 (100% bonds, 100% stocks, 60/40, glide 20. SORR at year 11, low assume return rates)
When SORR strikes at year 11 of retirement with low assumed return rates, 100% bonds (top left) do better than 100% stocks (top right).
The 60/40 portfolio (bottom left) is less affected by the negative returns during SORR than Glide20 (bottom right), which is slowly increasing stock percentage. As a result, 60/40 has more after SORR has passed and after 30 years.
Comparison of the Two Glidepaths
Glide10 never performs better than Glide20 except during periods of continuous growth. It is pretty easy to look through this scenario to see why: during continuous growth, a higher percentage of stocks performs better.
However, even when the simulated crash comes at year one, a slower rise to increased equities performed better. Perhaps a Glide15 would be interesting to look at as well.
Comparison of 60/40 to Bond Tents
Bond tents only beat a 60/40 portfolio when a market crash happens early during retirement AND when expected returns are high. In most scenarios, a 60/40 did quite well.
It seems likely that a set-it-and-forget-it investment allocation philosophy may be best throughout retirement.
Of course, in retirement, one could consider ratcheting up stocks in one’s asset allocation after a market crash, as that does increase future expected returns. However, that is market timing rather than a programmatic approach to asset allocation.
Lessons Learned with the Bond Tent Strategy
The average retiree probably doesn’t want to be 100% in stocks OR bonds when drawing down on their portfolio. What is your asset allocation 5 years from retirement?
Moreover, keep things simple. As the future is unknown, a 60/40 portfolio is as likely to perform as one with a bond tent over a traditional retirement.
Perhaps the largest criticism of bond tents is not one of efficacy but rather effectiveness. How difficult is it to talk an 80-year-old into increasing equity exposure over time rather than doing what is traditional—increasing bond ownership instead?
In times of high equity prices, however, consider a 60/40 portfolio five years before retirement. Then, sell off bonds when stocks are down. This is, in fact, our natural tendency anyway—the result: a slow increase in the overall asset allocation stock percentage.